
Rate My Restaurant: Predicting Restaurant Ratings
Problem Statement
The goal of this project is to help aspiring restaurant owners understand the ratings their planned restaurant might get on a review website, given the amenities they plan to include, and feedback received from soft openings. By using a combination of numerical, categorical, and text data, I utilized Natural Language Processing (NLP) and machine learning techniques to build a regression model that can predict the rating of a restaurant assigned by a customer. This will give restauranteurs an advanced awareness of customers’ sentiment towards the restaurants, allowing them to make any changes prior to opening to avoid receiving low ratings once in operation.
Background
The restaurant industry in the United States generated $833.1 billion in revenue in 2018 and was projected to reach $863 billion in 2019 [1]. Restaurants reviews and ratings on popular review websites are important factors in attracting new customers. Yelp is one of the most popular review websites, including over 135 million restaurant and business reviews and over 90 million users visiting the website per month. A study found that a one star increase in a Yelp rating leads to a 5% - 9% increase in revenue for a restaurant [2]. This underlines the financial importance of Yelp ratings on restaurants.
Data Source
The data for this project was acquired from the Yelp Open Dataset [3], which is published by Yelp both on its website and on Kaggle for educational and non-commercial purposes. The entire dataset is around 11 GB in size, consisting of separate JSON files containing data on a subset of Yelp’s businesses, reviews, user, check-ins, and tips respectively. The dataset is updated by Yelp periodically, and I downloaded the most recent version of this dataset as of October 2021, which at the time was denoted as Version 3. This version contains review data dating back from 2004 to early 2021. For this project, I have only worked with the business and review JSON datasets, focusing on restaurants in the state of Massachusetts which was the most represented state in the business dataset. For context, nearly 10% of the Massachusetts’ entire workforce worked in the restaurant industry in 2019 [4], making it a vital sector in the state’s economy, and thus showcasing the importance of this project’s goal for restaurants located in this state.
Data Processing
An exhaustive preprocessing of the business dataset was performed, as the business attribute column values were stored as JSON objects. Hence every unique key among the attribute JSON objects was mapped as a separate feature in the data frame, in order to prepare the dataset for modelling. Some of these attributes included price range, availability of outdoor seating, and serving of alcohol. Columns with excessive missing values were dropped, and the remaining business attribute columns had their missing values imputed with the mode value, given the categorical nature of those columns. Furthermore, the 20 most frequent restaurant categories were also extracted and used as separate binarized features.
Exploratory Data Analysis (EDA) and Feature Engineering
Figure 1 shows the distribution of the dependent variable, which is the rating of a restaurant defined as the number of stars assigned by the reviewer. 64% of the reviews have a rating of greater than or equal to 4 stars, while 36% of the reviews have a rating of less than 4 stars.
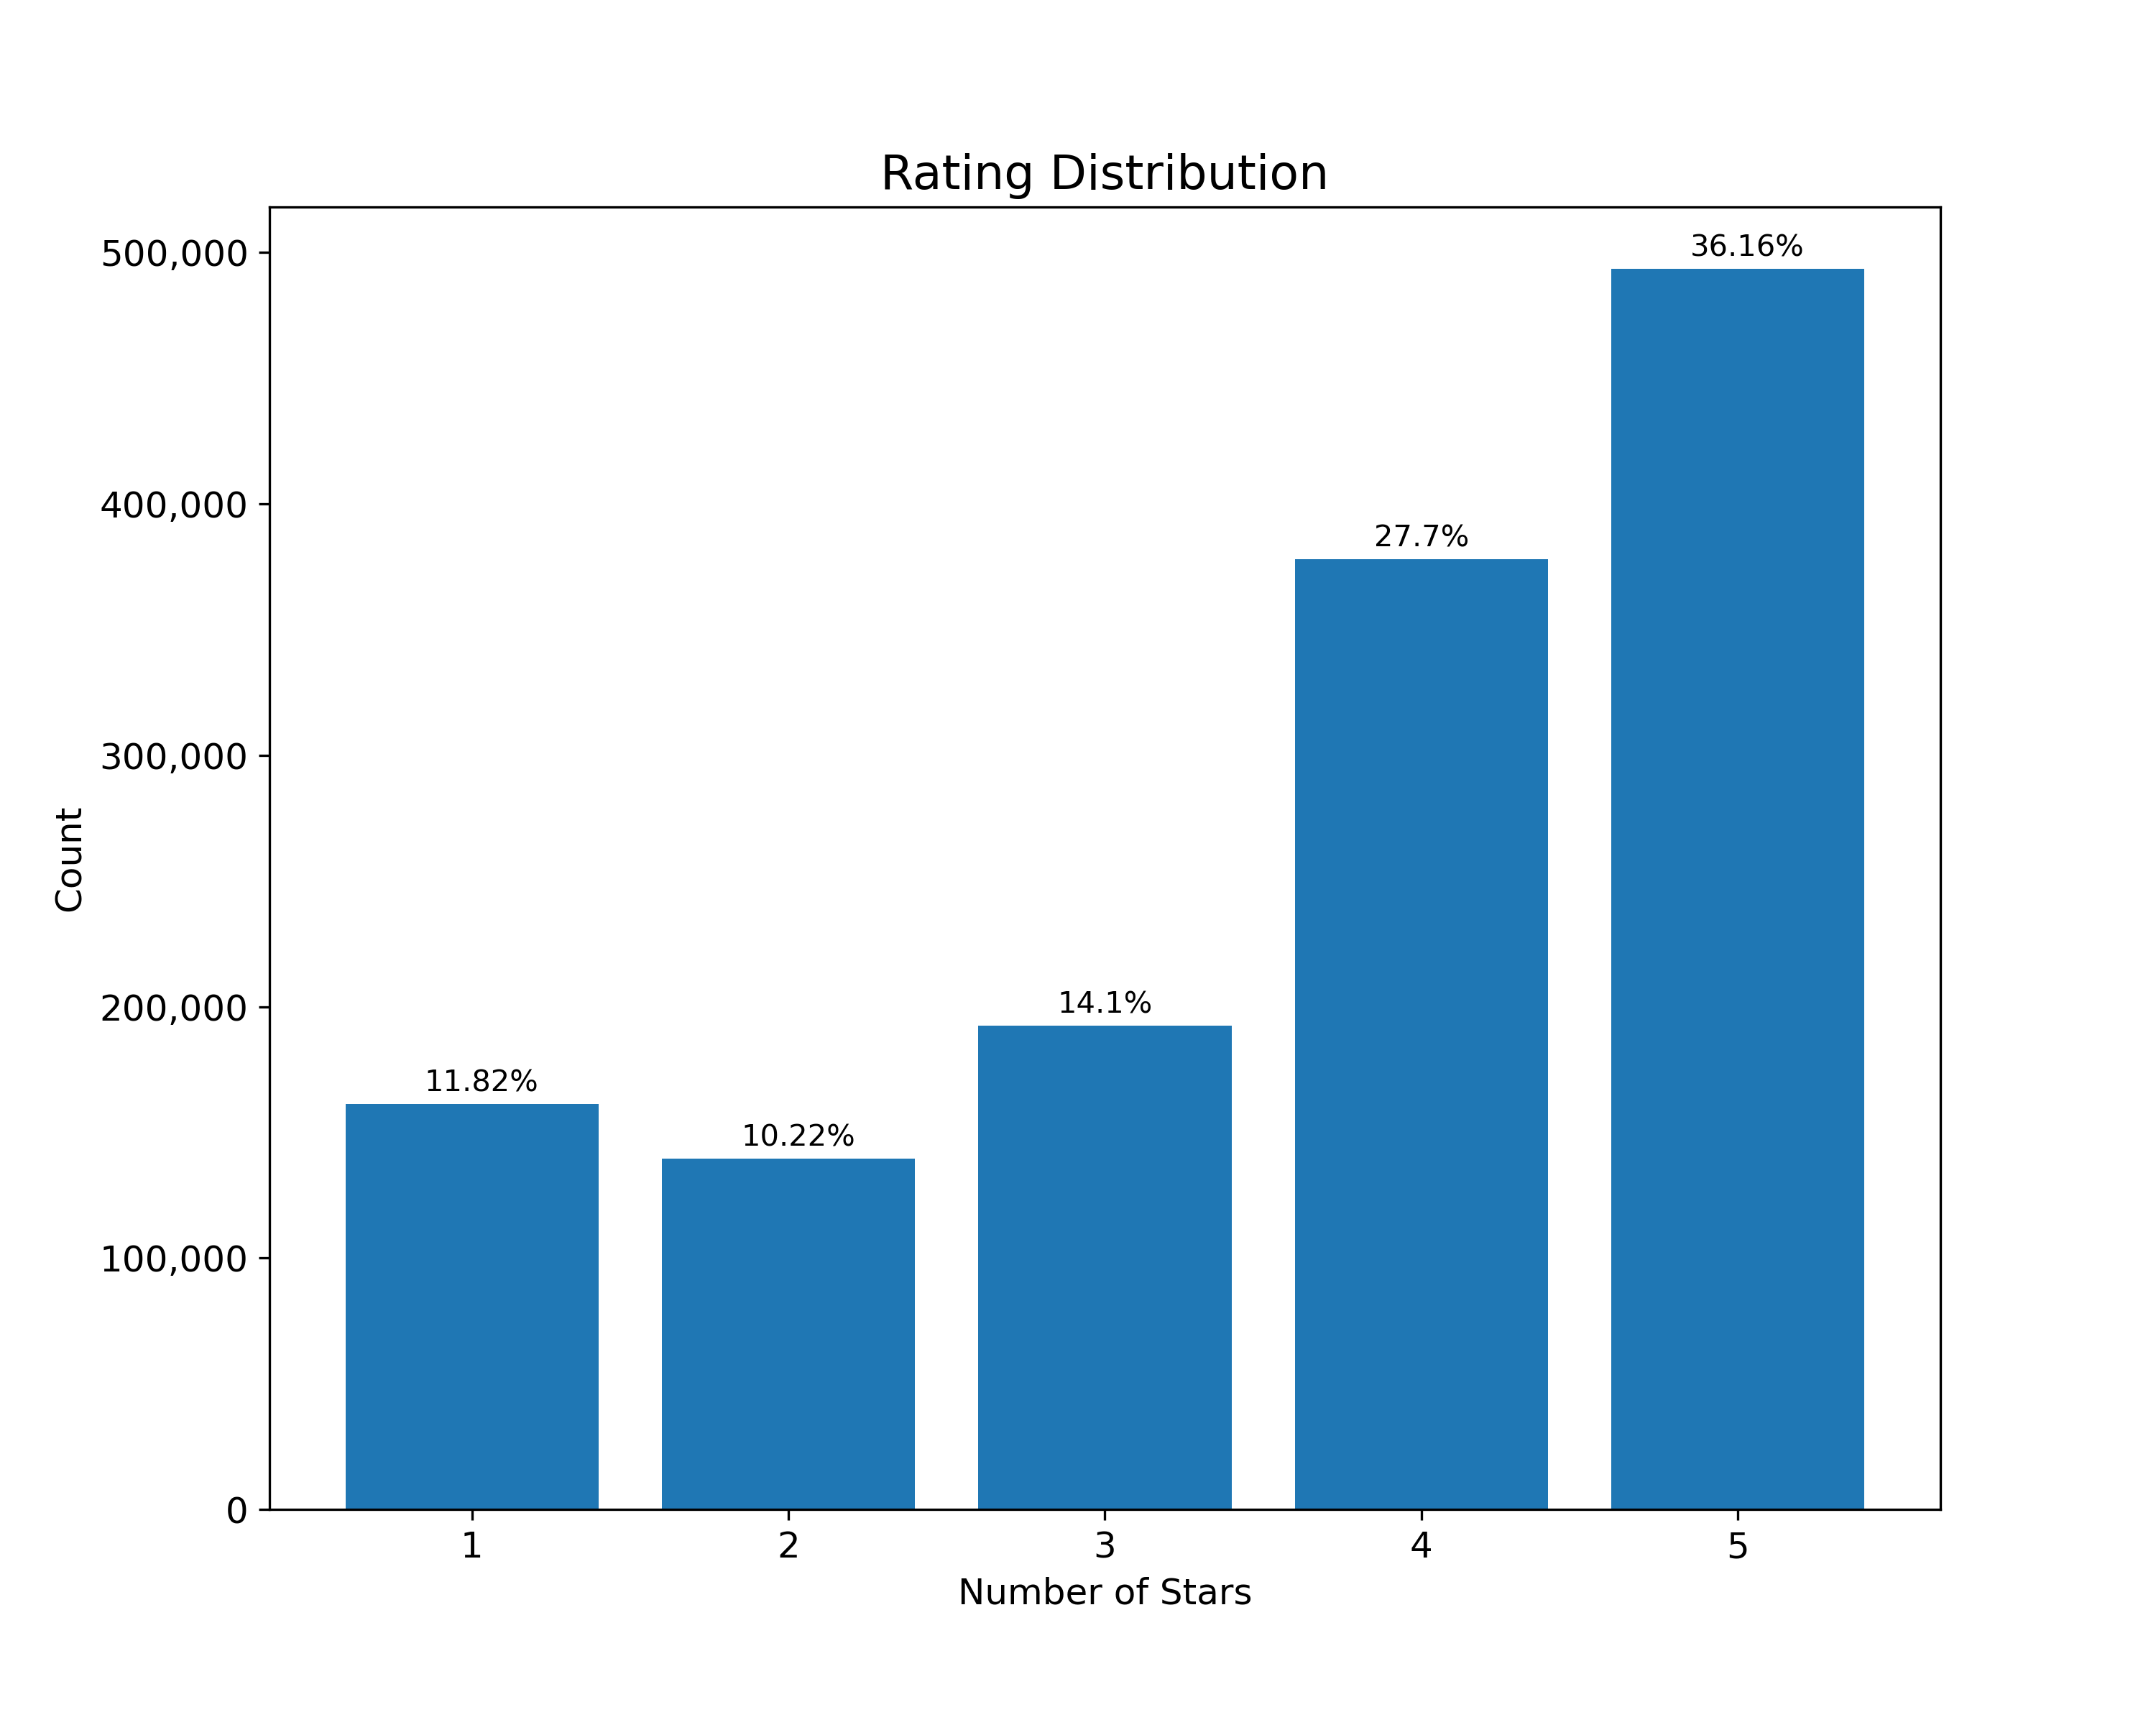 Figure 1: Distribution of restaurant review ratings
There were no obvious trends observed when plotting the distribution of ratings with each of the numeric variables from the business dataset alone, hence feature engineering was also explored. Some feature engineering variables included review length, number of weekly reviews per restaurant, and number of branches for chain restaurants.
Natural Language Processing (NLP) and Modelling
The NLP encoders that were explored included a Bag of Words (BoW) and TF-IDF vectorizer. For each vectorizer, the effect of stemming versus lemmatization was also evaluated. To keep memory size and run times manageable, each vectorizer was limited to encoding both unigram and bigram tokens, limiting the total number of tokens to 3,000. The candidate machine learning models that were evaluated included Linear Regression, Decision Tree Regression and XGBoost Regression. Grid search cross validation was used to select the best text vectorizer and model hyperparameter combination for each of the candidate models. The selection metric used was mean absolute error, but R2 values were also monitored. Table 1 shows the test set accuracy results for the various pipelines that were selected.
| Model | Vectorizer | Mean Absolute Error (Stars) | R2 |
|---|---|---|---|
| Ridge Regression | TF-IDF with Stemming | 0.65 | 0.61 |
| XGBoost Regressor | TF-IDF with Stemming | 0.66 | 0.60 |
| Decision Tree Regressor | TF-IDF with Stemming | 0.89 | 0.25 |
Table 1: Regression model scores on the test set. Vectorizer and hyperparameters were selected via grid search cross validation.
As indicated by Table 1, the best performing pipeline comprised of a TF-IDF vectorizer with stemming, and a Ridge Regression model. This pipeline produced a mean absolute error of 0.65 stars and an R2 value of 0.62. Hence, our model can explain 62% of the variance in the ratings.
Findings
Figure 2 displays the top 20 positive and negative tokens based on coefficient values.
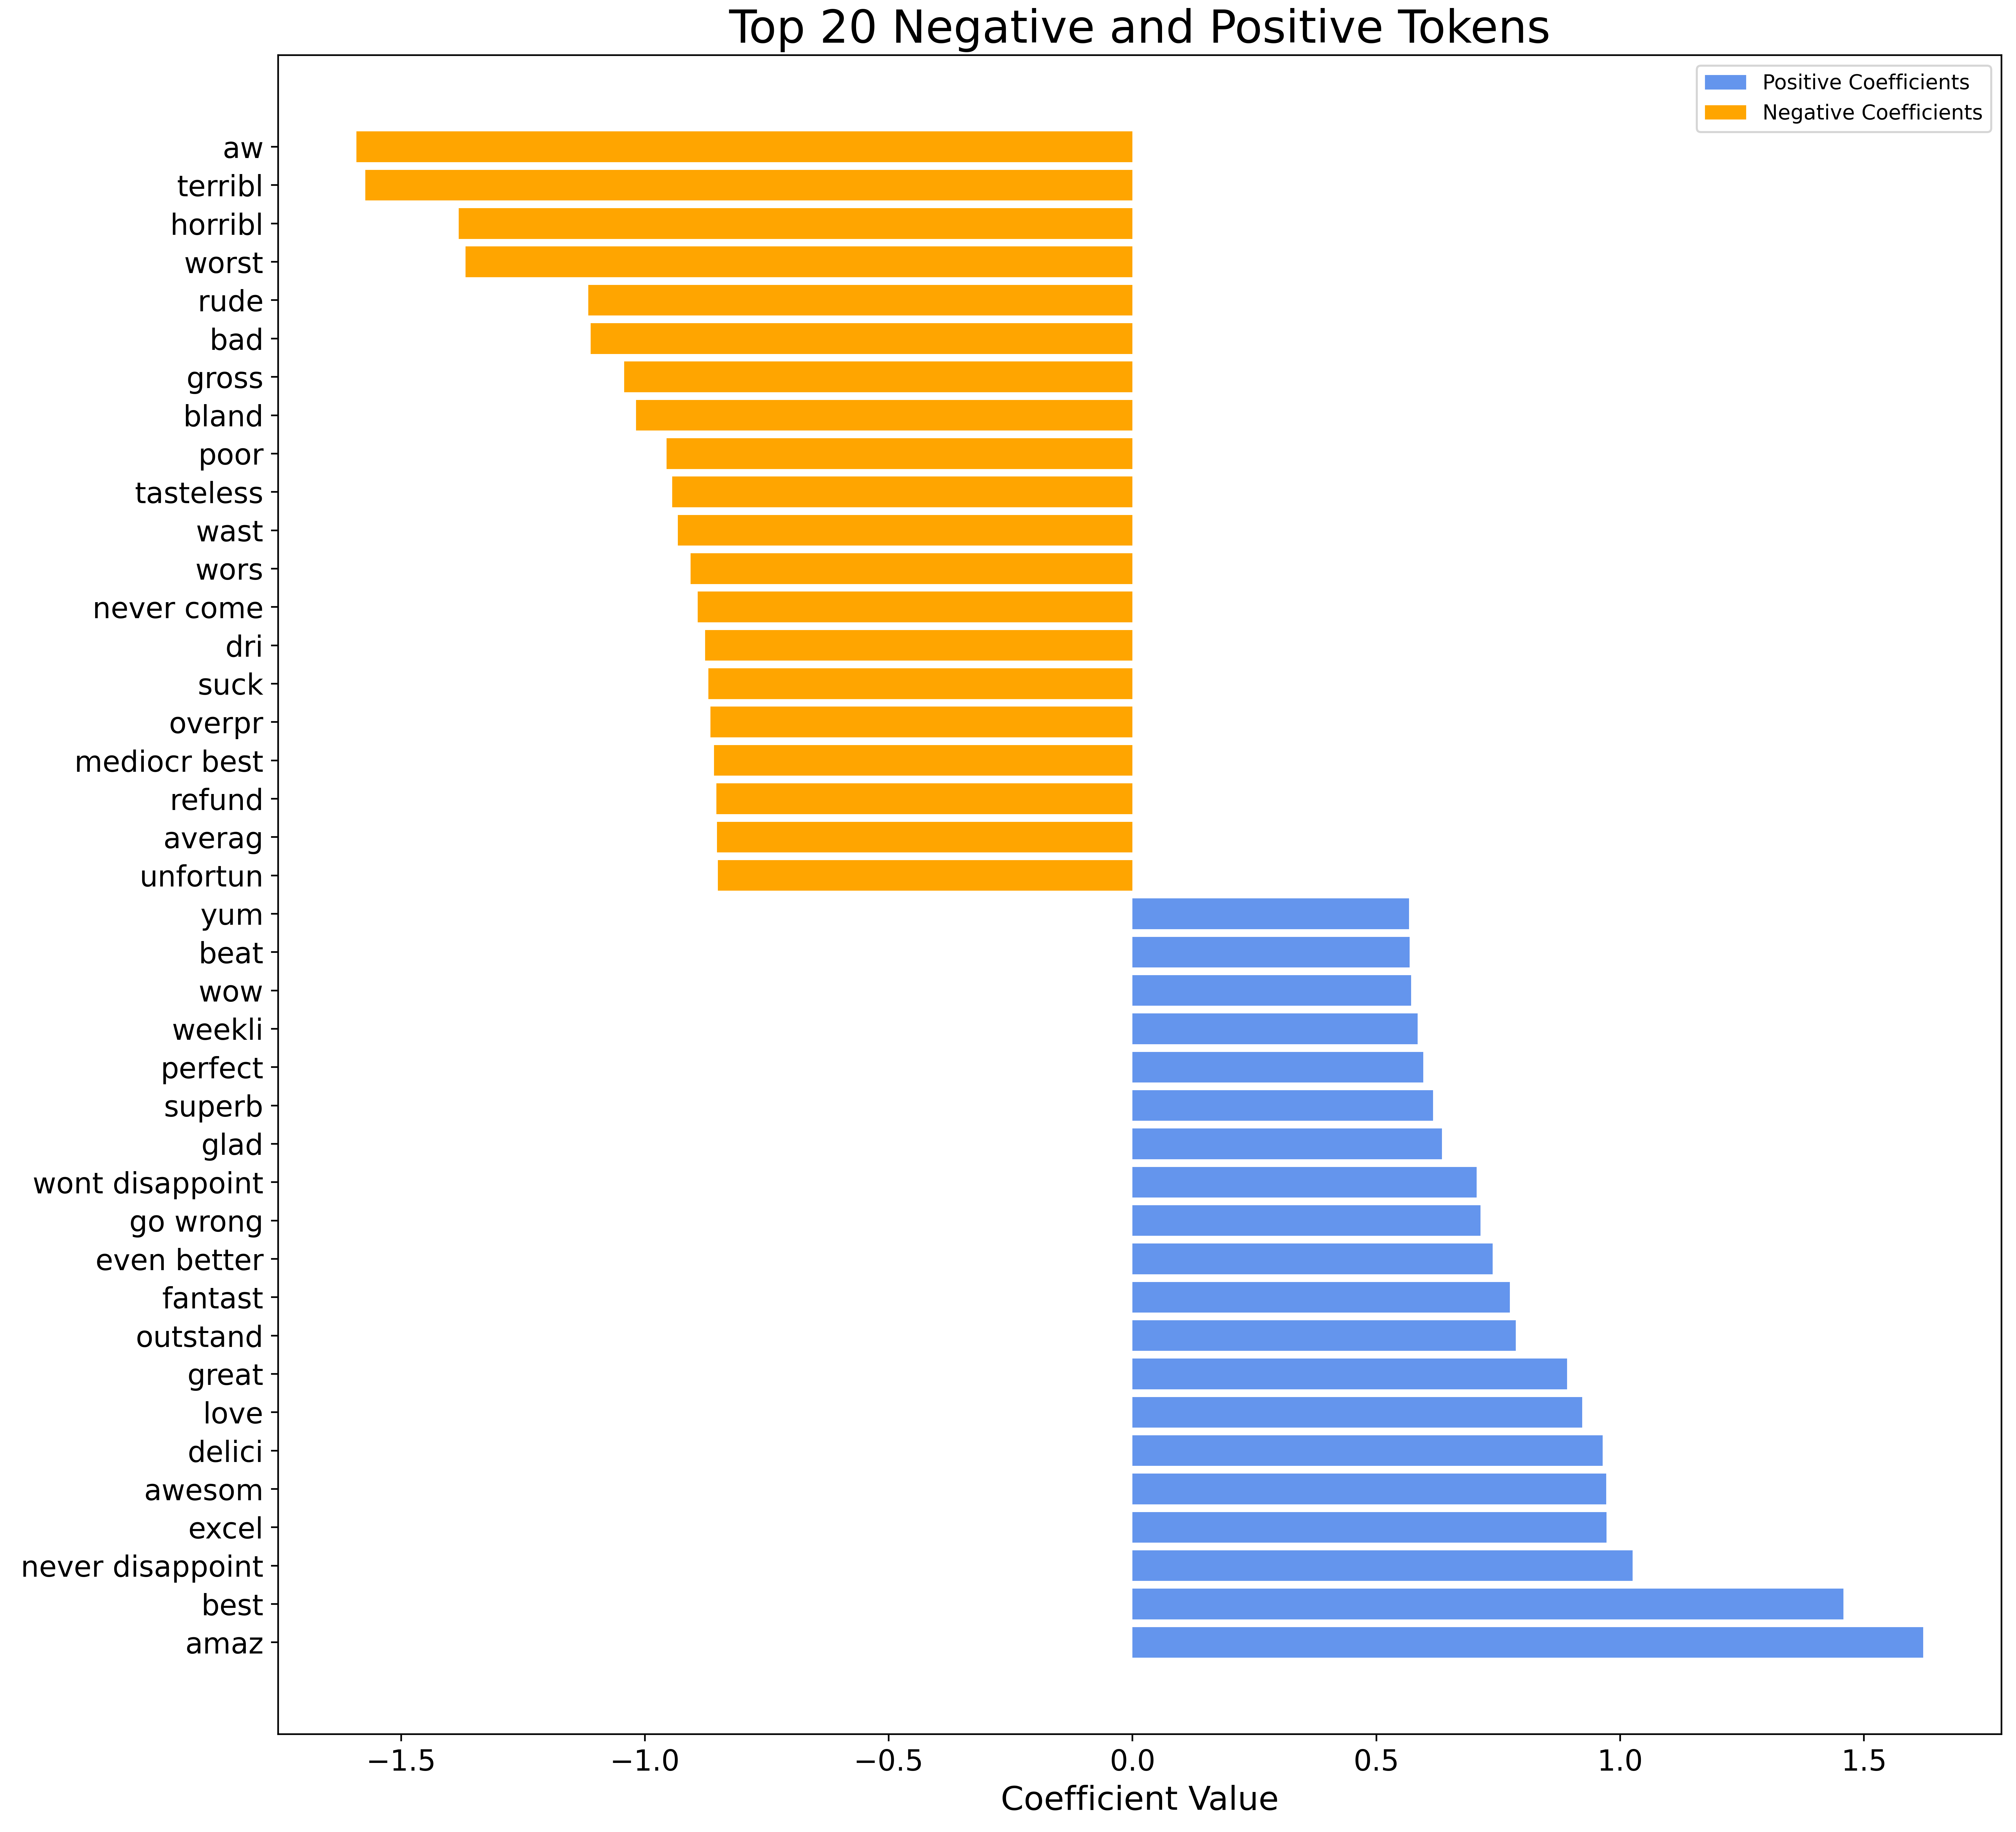 Figure 2: Top 20 Positive and Negative Tokens by Regression Coefficient Value
To summarize, the key findings of the study are as follows:
- Dining and customer experience have far more impact on the rating compared to restaurant attributes, as indicated by comparing token coefficients to numeric and categorical feature coefficients.
- Food taste has a noticeable impact on the rating, as descriptions like ‘gross’, ‘bland’, and ‘tasteless’ fall within the top 20 negative coefficient values.
- Staff deemed as ‘rude’ by the customer will lead to a noticeable decrease in rating.
- For chain restaurants, the rating tends to decrease with increasing number of branches.
Web Application
The final model was deployed as a Flask web app hosted on Heroku. Upon landing at the home page, the user is prompted to complete a form, where the user enters the restaurant location in text field, answers simple yes or no questions about available amenities using drop down menu, picks the best categories for this restaurant, and enters the review text into the text field. After hitting the predict button, the app then displays the predicted rating for the restaurant.

Figure 3: The Rate My Restaurant web app in action.
Conclusion
In this study, we have trained a model that can predict the rating of a restaurant review with a mean absolute error of 0.65 stars. Compared to simply predicted the average test set rating for all predictions, we have improved the mean absolute error by 0.51 stars (32% reduction). The model can explain 61% of the variance in ratings. We have also identified the features that have the biggest influence on rating score.
Next steps
As a next step, I would like to analyze the change in average restaurant rating over time, using a time series analysis approach. This would be of greater use to existing restaurant owners rather than aspiring ones. Existing restaurant owners might want to understand how to increase their current Yelp rating in the near future and hence their revenue. To do this with the existing dataset, the individual review ratings for each restaurant would have to be aggregated by specific time steps. In addition, it would be interesting to see how this model performs for restaurants located outside of Massachusetts, and if required, the model could be retrained on a bigger subset of restaurants given more time and computing power.
References
[1] R. Ruggless, “U.S. restaurant sales to reach record $863B in 2019, NRA says,” Nation’s Restaurant News, 5 April 2019. [Online]. Available: https://www.nrn.com/sales-trends/us-restaurant-sales-reach-record-863b-2019-nra-says.
[2] M. Luca, “Reviews, Reputation, and Revenue: The Case of Yelp.Com,” Harvard Business School NOM Unit Working Paper No. 12-016, vol. 12, no. 06, 2016.
[3] Yelp Inc., “Yelp Open Dataset,” n.d.. [Online]. Available: https://www.yelp.com/dataset). [Accessed 21 October 2021].
[4] R. Luz, “Massachusetts’ strong restaurant industry depends on diners (Outlook 2019 Viewpoint),” MassLive, 17 February 2019. [Online]. Available: https://www.masslive.com/business-news/2019/02/massachusetts_strong_restaurant_industry.html.